Last fall, Americans young and old declared, "We are the 99 percent," pitched tents in public spaces, and settled in. For a few months, cities played host to mini-villages and daily protests. Although occupiers vow to keep the movement going, evictions and raids have shut down the encampments in most major cities—for now.
We watched these events unfold on YouTube and in our own downtowns, but we lacked a macro view of the movement during its most frenetic months. This map is intended to provide such perspective—a nationwide survey of Peak Occupation. While many of these protests continue their slow burn, the dates on this map mark the time period of highest activity, before most occupiers were forced out.


 Let us all bow before Gary, the Internet's most adventurous feline. Photo credit: James Eastham
 Gary the Cat enjoys some paddling. Photo credit: James Eastham
 James and Gary chat with Ryan Reed and Tony Photo credit: Ryan Reed


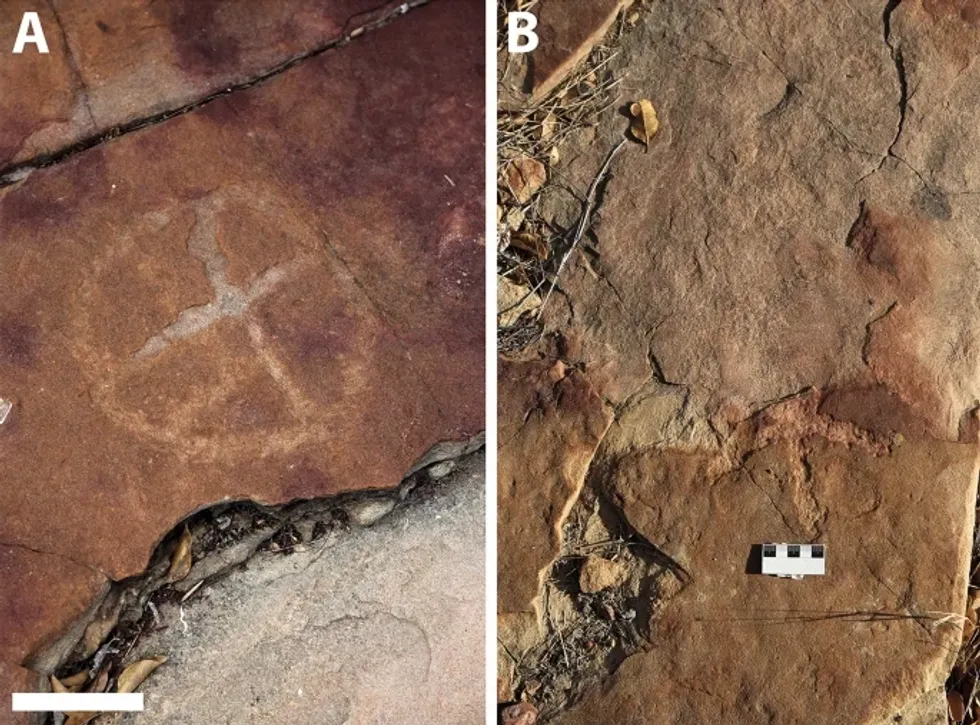
 Rock deterioration has damaged some of the inscriptions, but they remain visible. Renan Rodrigues Chandu and Pedro Arcanjo José Feitosa, and the Casa Grande boys
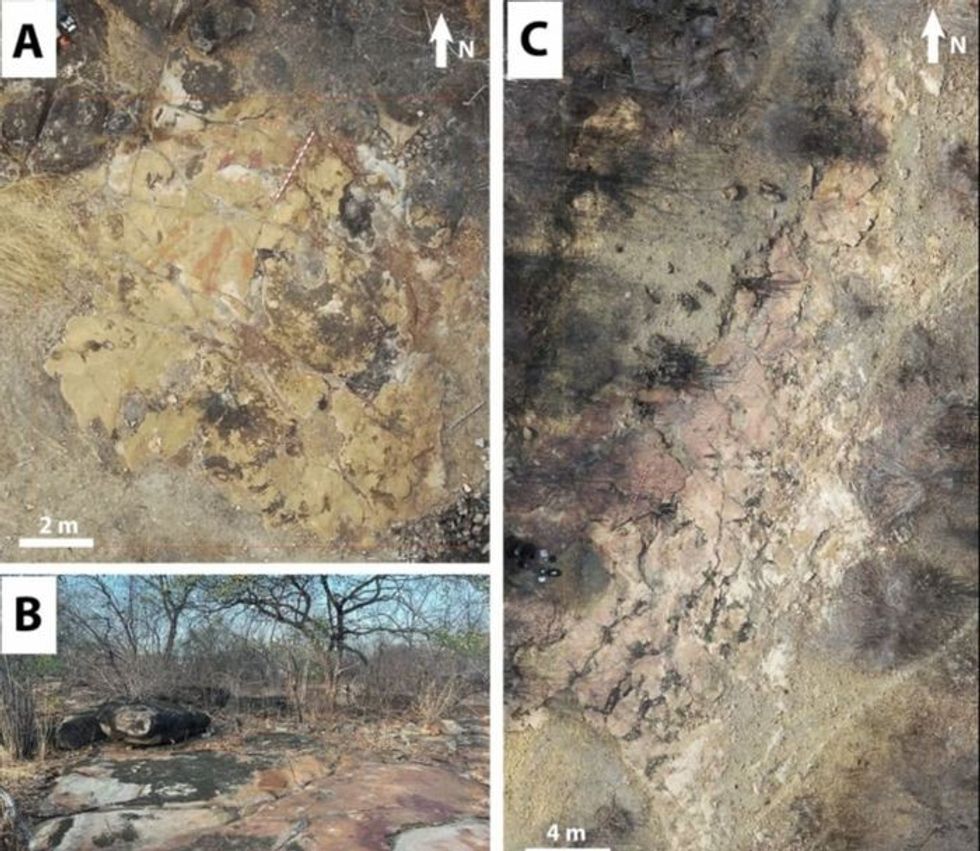
 The Serrote do Letreiro site continues to provide rich insights into ancient life.

 The contestants and hosts of Draggieland 2025Faith Cooper
 Dulce Gabbana performs at Draggieland 2025.Faith Cooper
 Melaka Mystika, guest host of Texas A&M's Draggieland, entertains the crowd
Faith Cooper


