Search


We have a small favor to ask of you
Facebook is critical to our success and we could use your help. It will only take a few clicks on your device. But it would mean the world to us.
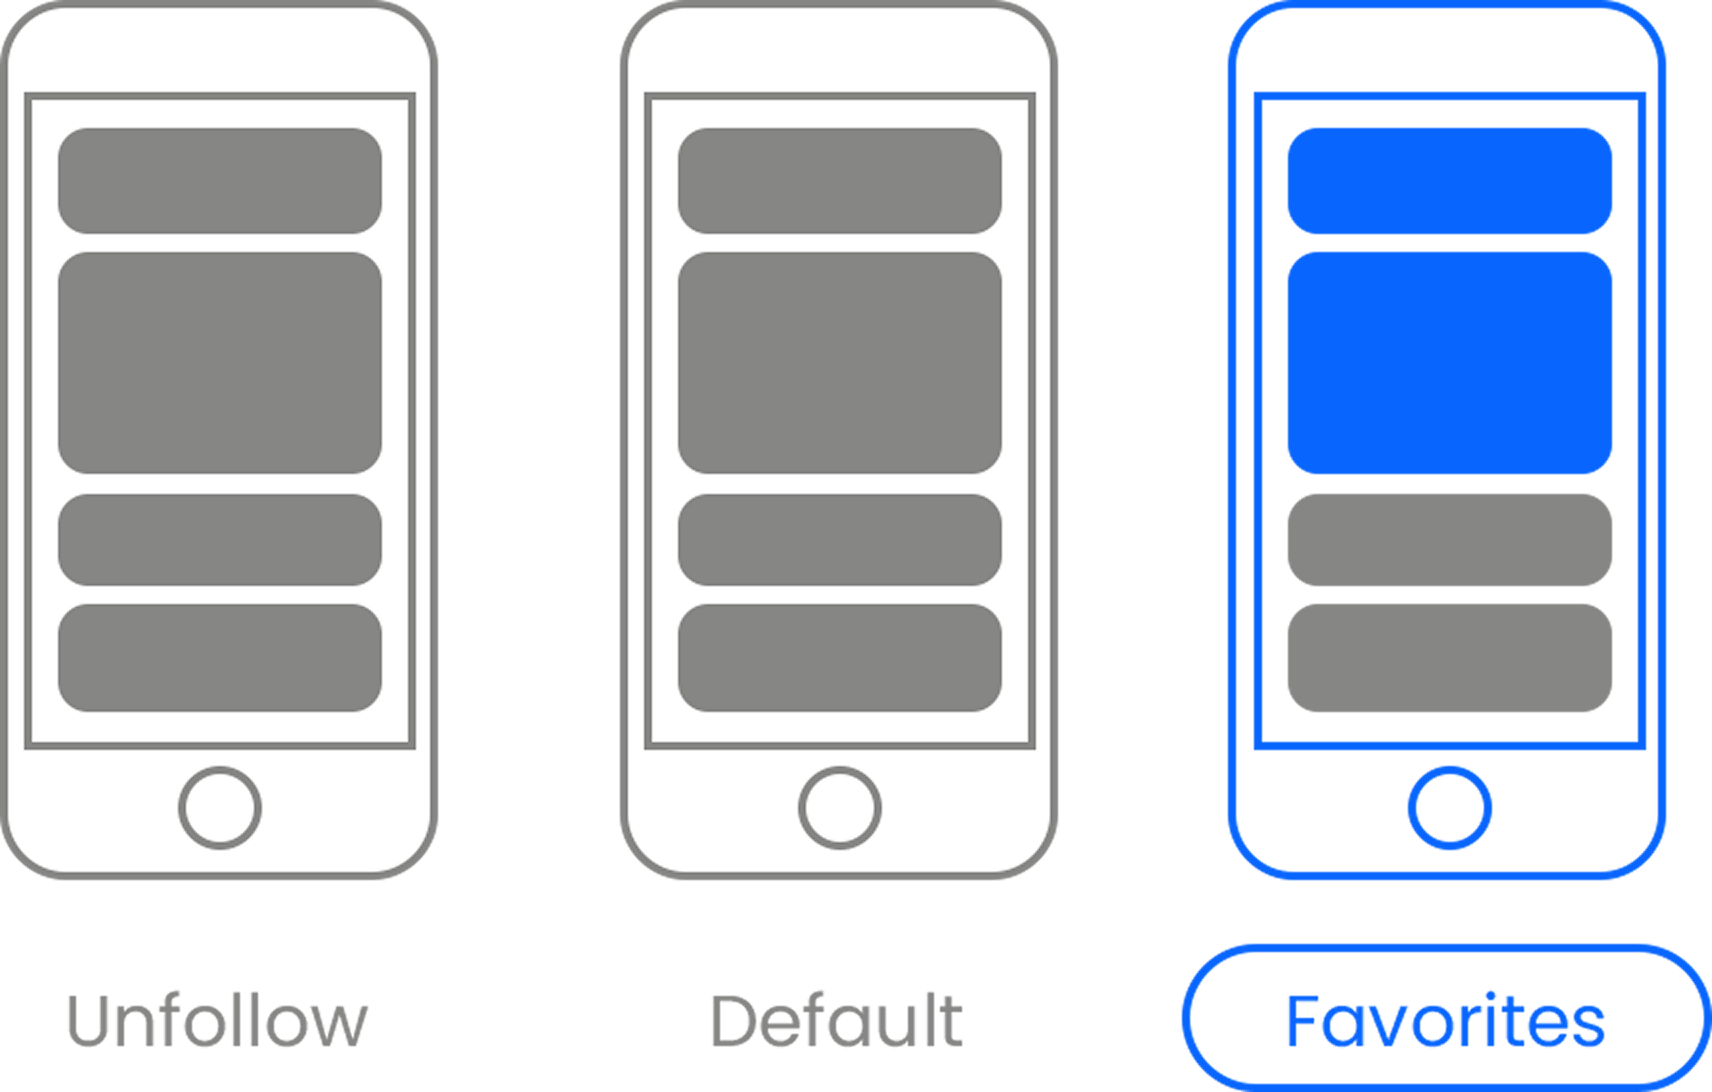
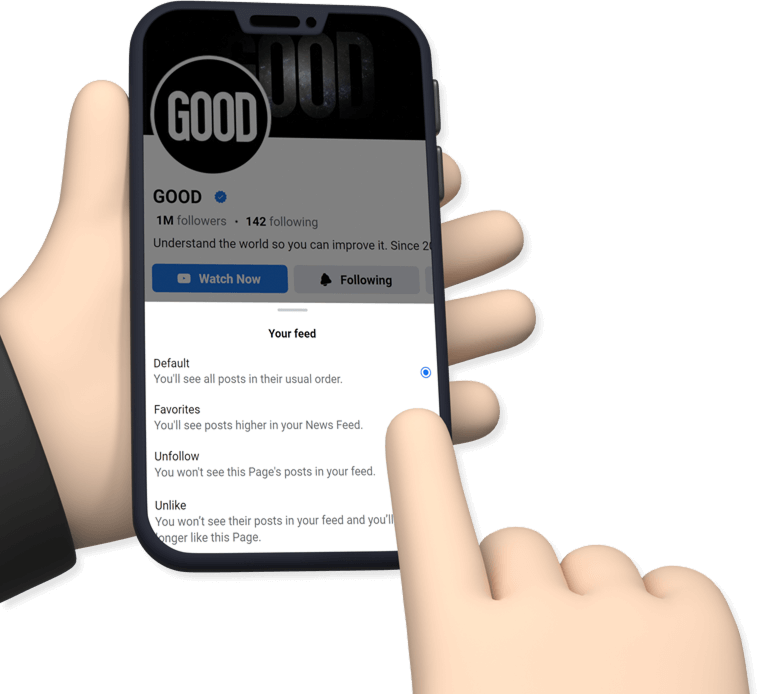
Here’s the link . Once there, hit the Follow button. Hit the Follow button again and choose Favorites. That’s it!